Every covered call on the board, honestly graded.
A research tool for income writers. Every strike and expiration graded against comparable peers within the same symbol. Standouts jump out. Thin corners stay honest.
Built by a 25-year covered-call trader. No spam. One email when it's ready.
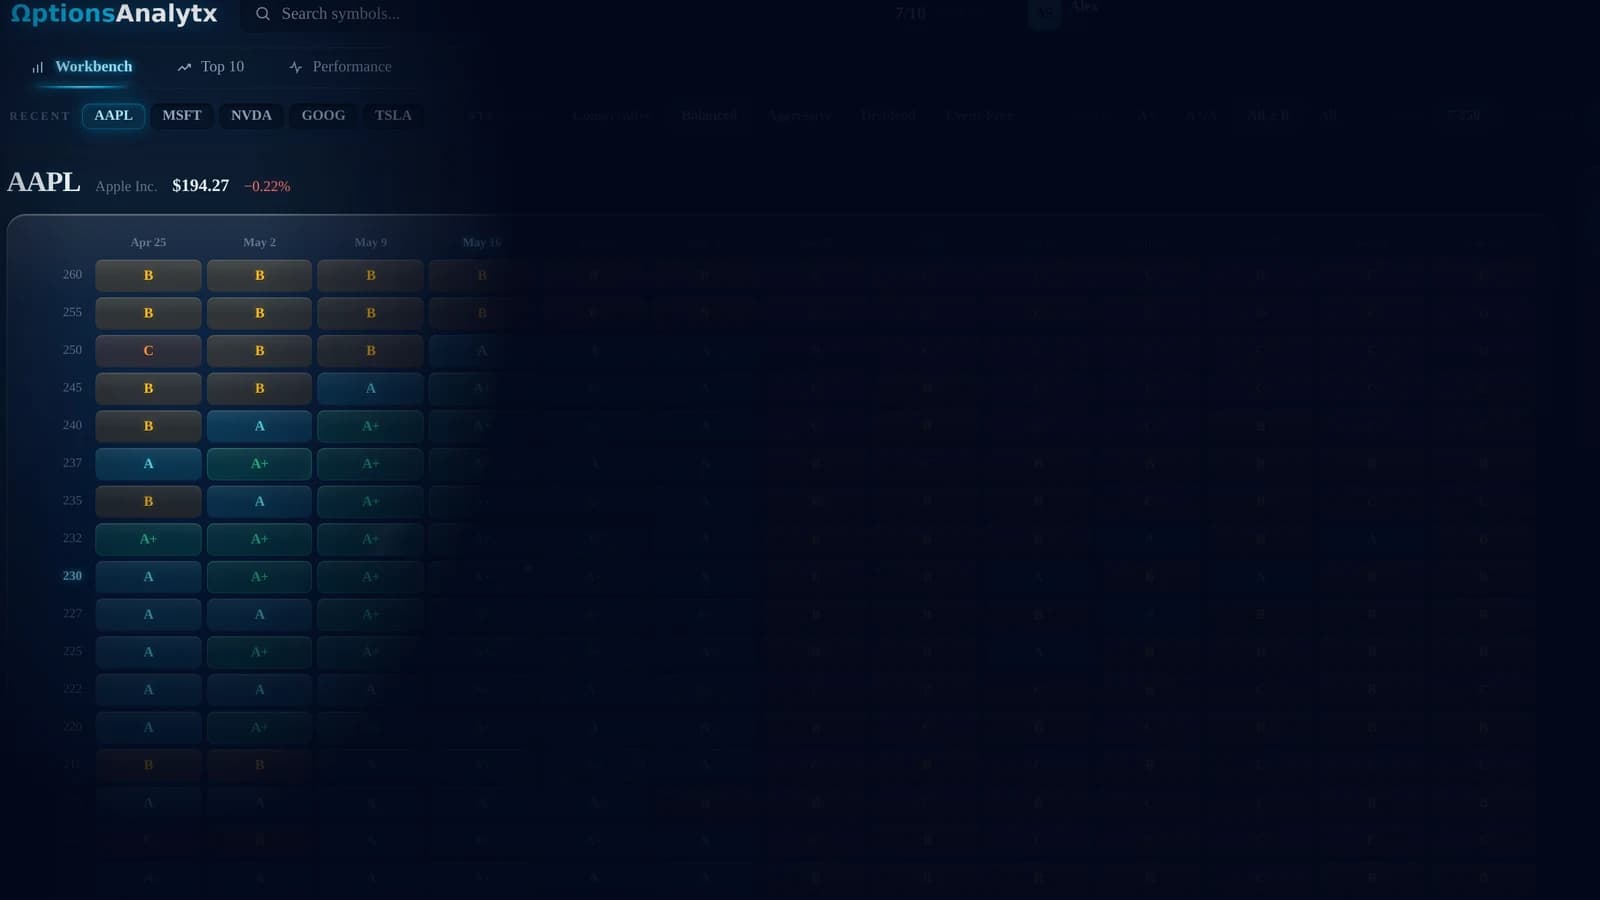
A workbench view: multi-expiration heatmap graded within symbol
What it is
A research tool, not a picks engine.
You bring the symbol and the writing philosophy. The heatmap shows you where the standouts are.
Standout for its kind
Grades compare each contract against peers of similar horizon and moneyness, within the same symbol. A+ means genuinely standout for that trade type, not the highest premium on the board.
Honest cells where we can't stand behind a grade
When the data can't support a confident grade, we show the contract with no color. No fabricated confidence. This is the opposite of a black box.
Multi-DTE by design
Every expiration from weeklies out to LEAPs, every strike in the covered-call zone. See where the standouts are across horizons, not just the ones close to expiration.
Why this tool exists
Boring is better.
I've been writing covered calls for 25 years. Most of that time on stable dividend-paying stocks that don't make anyone rich in a hurry, but do generate consistent income when you get the setup right.
Every retail screener I tried filtered on the wrong things or ranked on premium alone. None of them told me which setup was genuinely a standout for its kind. So I built one.
OptionsAnalytx is that tool. A research surface that grades every covered-call contract on the board, with honest cells where the data is too thin to grade reliably. Nothing sold as a picks engine. Nothing promised as a get-rich shortcut.
Just a better way to see which contracts are worth writing.
— Alex Zaliznyak, founder
What you get
What ships when the tool is ready.
Honest about what's in the first release and what comes after.
At launch
The Workbench + Learn
- ✓Multi-expiration heatmap for every symbol we cover
- ✓Peer-relative grading with honest ungraded cells
- ✓Inspector detail on any contract you click
- ✓Learn section explaining exactly how the grading works
After launch
What's in the plan next
- ·Watchlists to track your symbols across scans
- ·Curated weekly research with tracked outcomes
- ·Broader symbol coverage as the data supports it
- ·Position tracking and roll analysis
Not promising a date. Shipping when it's honestly ready.
Pricing
Start free. Pay when you need more.
One clear paid tier. No trial cliff, no founding tier gimmicks, no upsell treadmill.
Free
Enough to actually use the tool.
- ✓10 workbench scans
- ✓Default sellable-band view (near-dated, OTM strikes writers actually use)
- ✓Full Learn section access
- ✓Inspector detail on every graded contract
Pro
Everything free, plus the room to explore.
- ✓Unlimited scans
- ✓Unlimited watchlists
- ✓Full grid expansion (LEAPs, deep-ITM, far-OTM)
- ✓Everything in Free
Pricing available when the tool launches. Join the list to hear when.
One email when it's ready.
Get first access to the covered-call research tool. No launch countdown, no urgency games. Just an email when the tool is ready to try.
Built by a 25-year covered-call trader. No spam.